OVRDC
www.ovrdc.org
Map Examples
ovrdc.github.io/gis-tutorials
This Presentation
www.ovrdc.org/gis/presentations
What
Why
How
What
Are Vector Tiles?
Vector Tiles are a representation (serialized data) of geographic features and their underlying data for a specific zoom level and bounding box. Lines and polygons may be simplified and points may be omitted. ~ Adapted from Wikipedia & Mapbox
Web Map Tiles
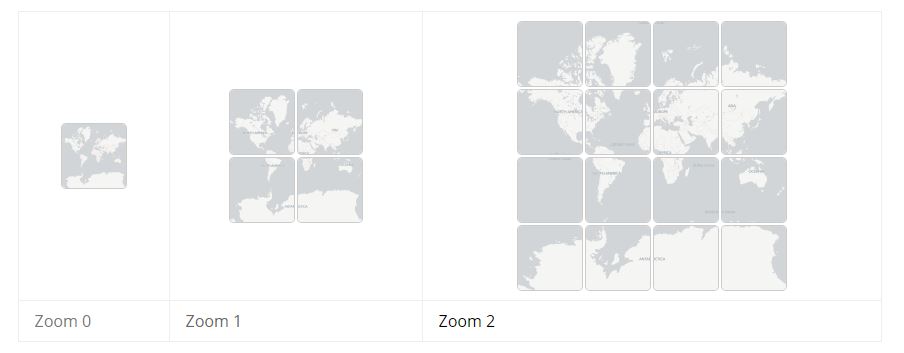 img source: leafletjs.com/examples/zoom-levels
Mapbox Vector Tiles (MVT)
MVT is slowly becoming an industry standard.
Why
Use Vector Tiles?
Client-Side Rendering
=
Potential Savings Server-Side
Unlimited
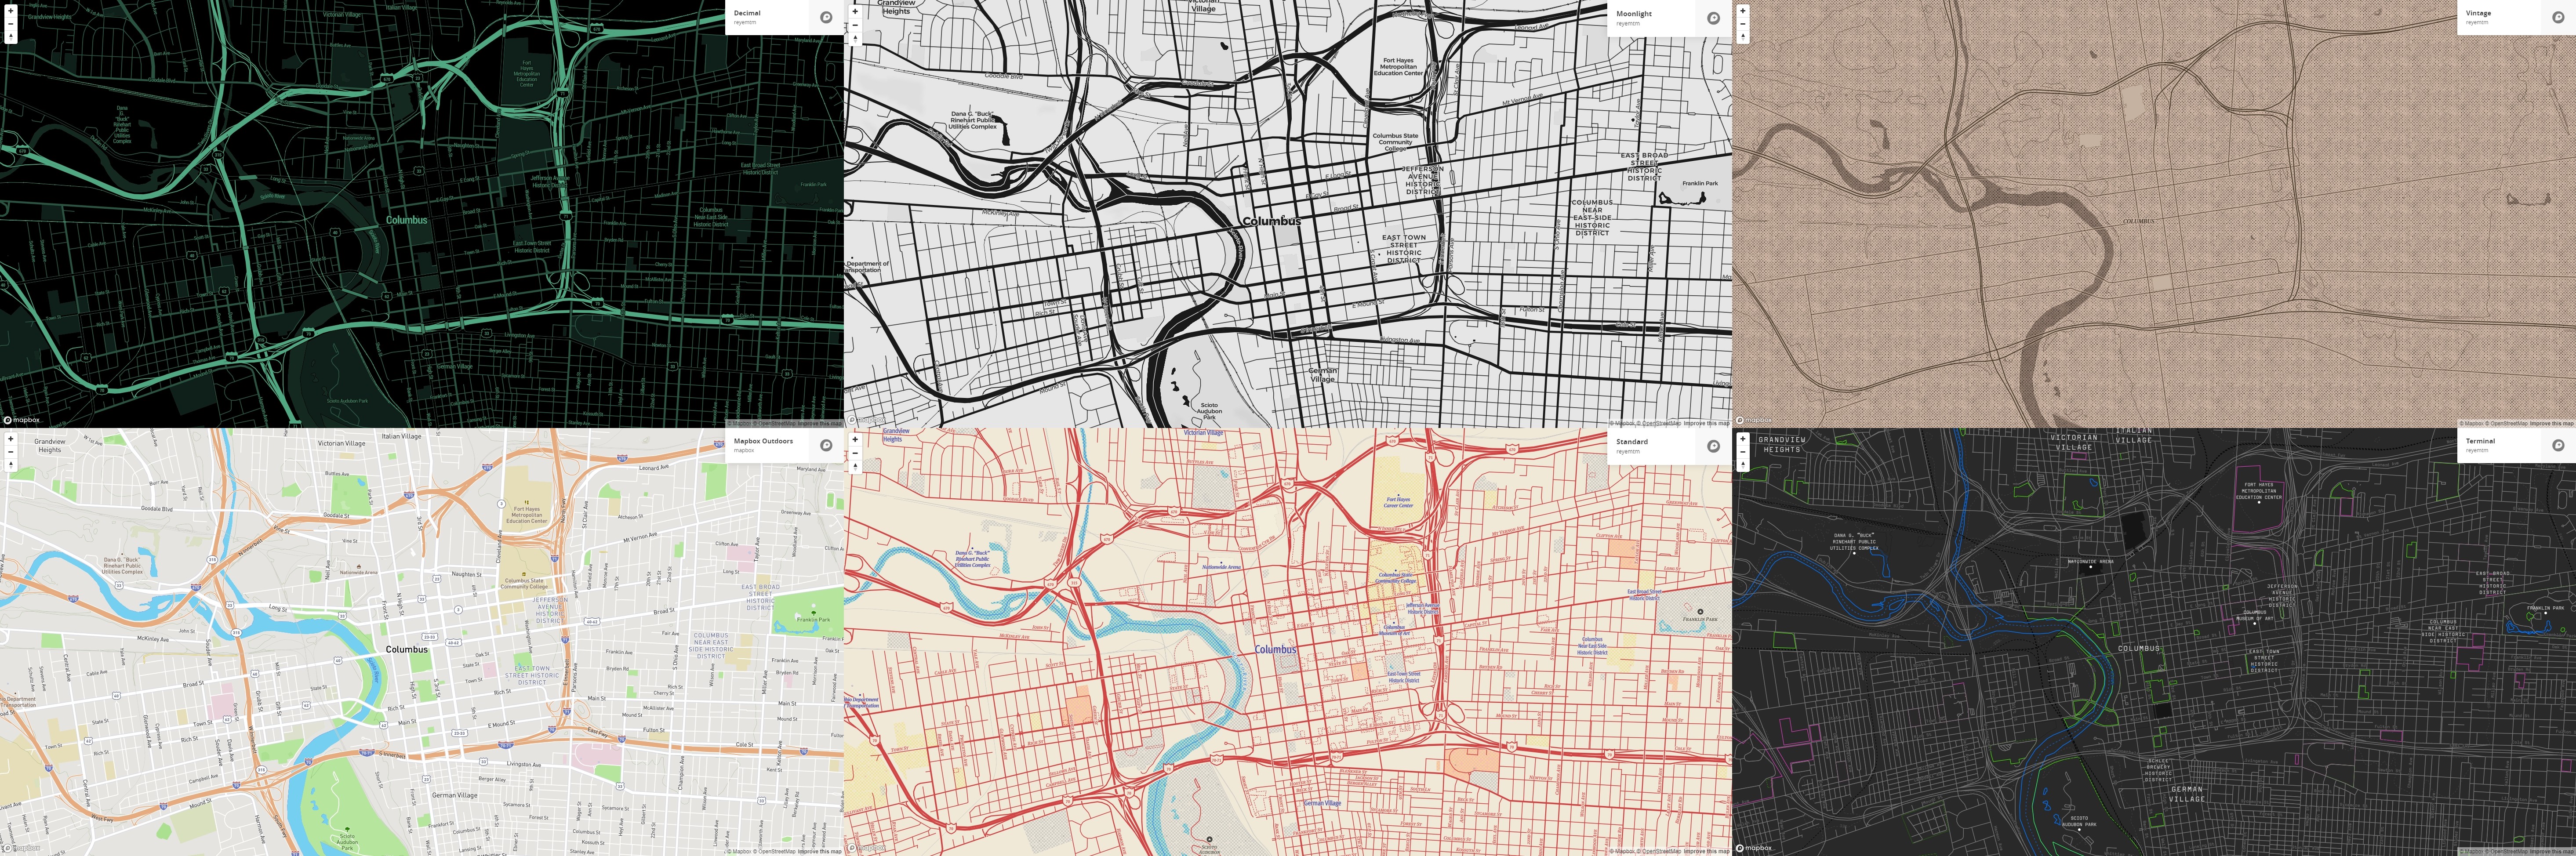
Basemaps
Access to Attribute Data
Performance
~70 Image Requests, 1100kb
OpenStreetMap Raster
~45 Image Requests, 749kb
Vector Tile Basemap
~20 Vector Tile requests, 759kb
This includes feature data!!
How
Raw Data
--> GeoJSON
--> Vector Tiles
--> Server
--> JavaScript API
--> Browser
or just use Mapbox and Mapbox Studio
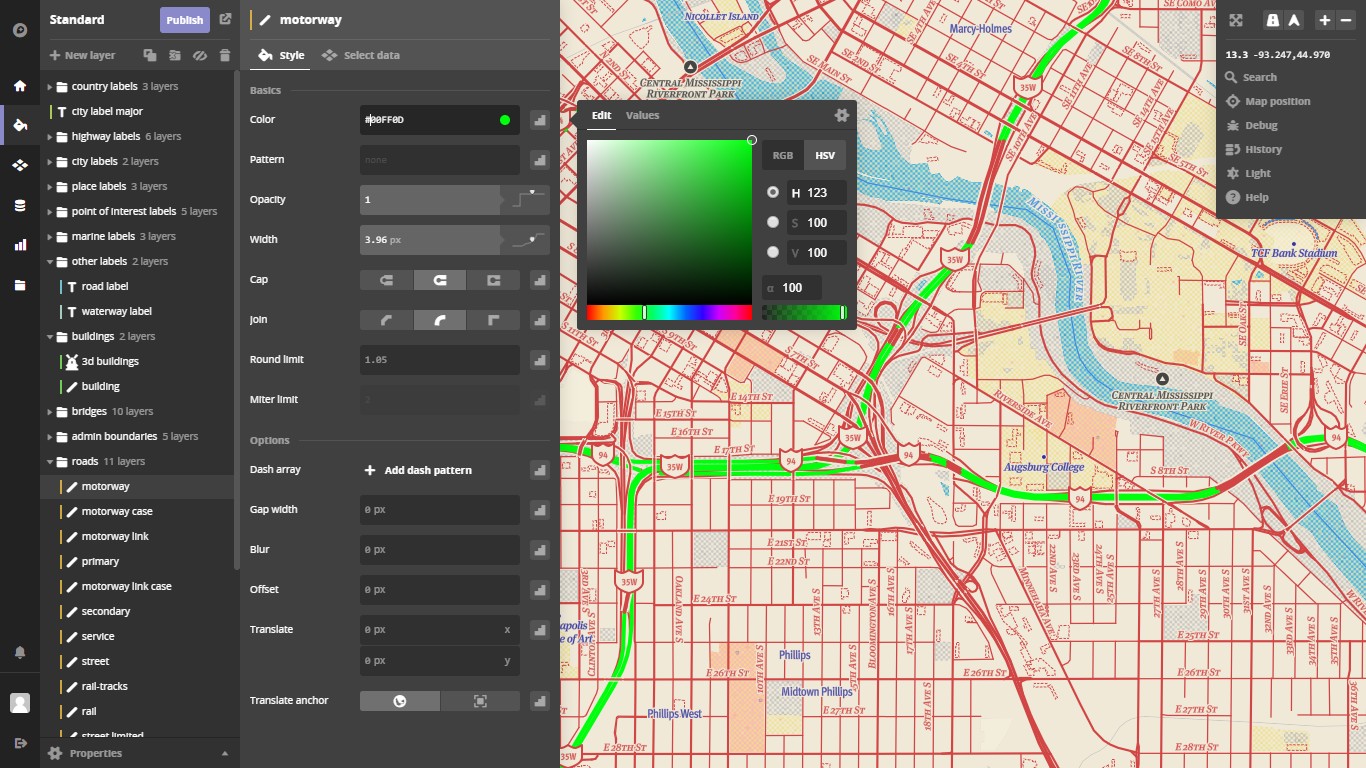
Mapbox Studio
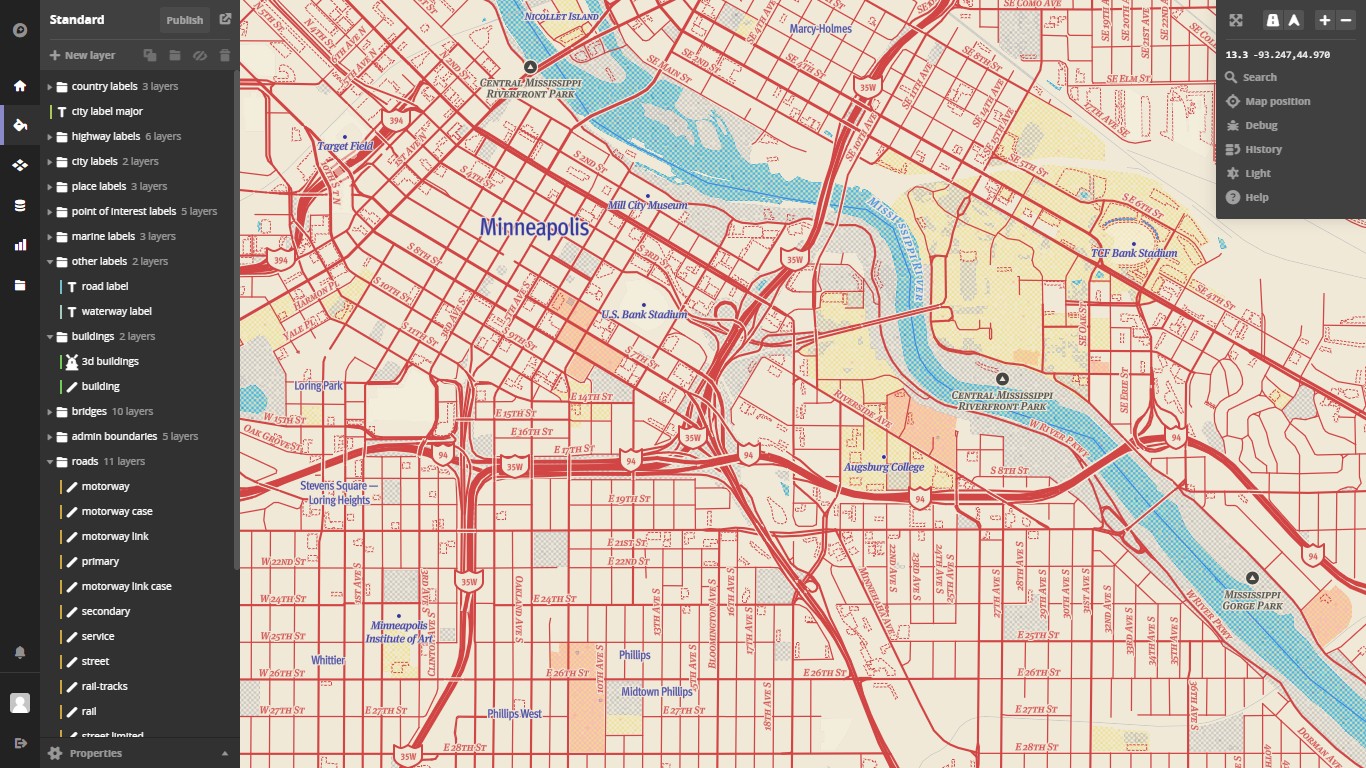
Mapbox Studio
Coding the Map from Scratch
Tools
Atom/Notepad++
OpenMapTiles - Basemap Tiles
esri2open/mapshaper - GeoJSON
Tippecanoe - Vector Tiles
Node JS & Nginx - Tile Server
Leaflet/Mapbox/OpenLayers
Mapbox Web Map Building Blocks
Sources
GeoJSON, Vector Tiles, Raster Tiles, Images, Videos
Layers
Background, Line, Circle, Fill, Fill-Extrusion, Symbol
Properties
Bearing, Pitch, Light, Sprites, Glyphs, Transition
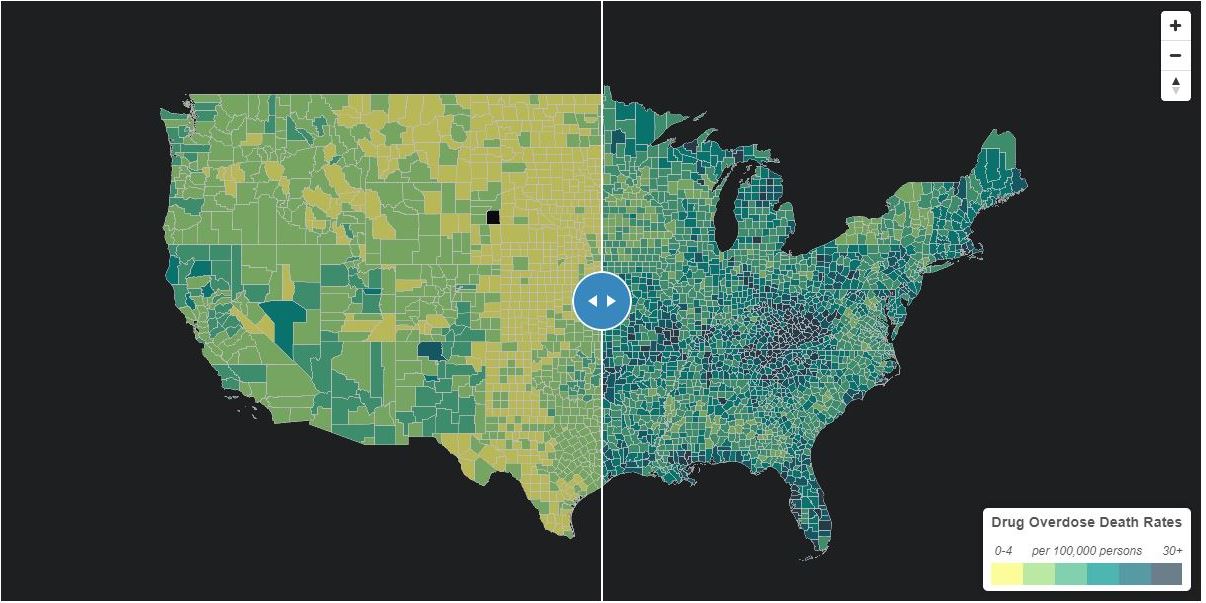
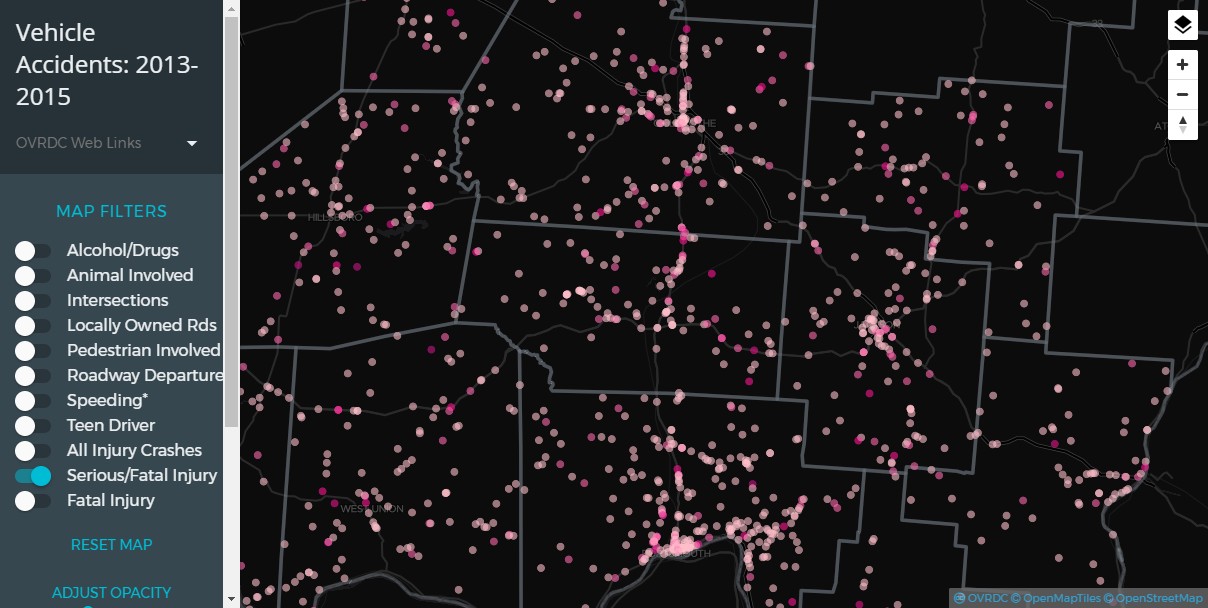
Fill & Query
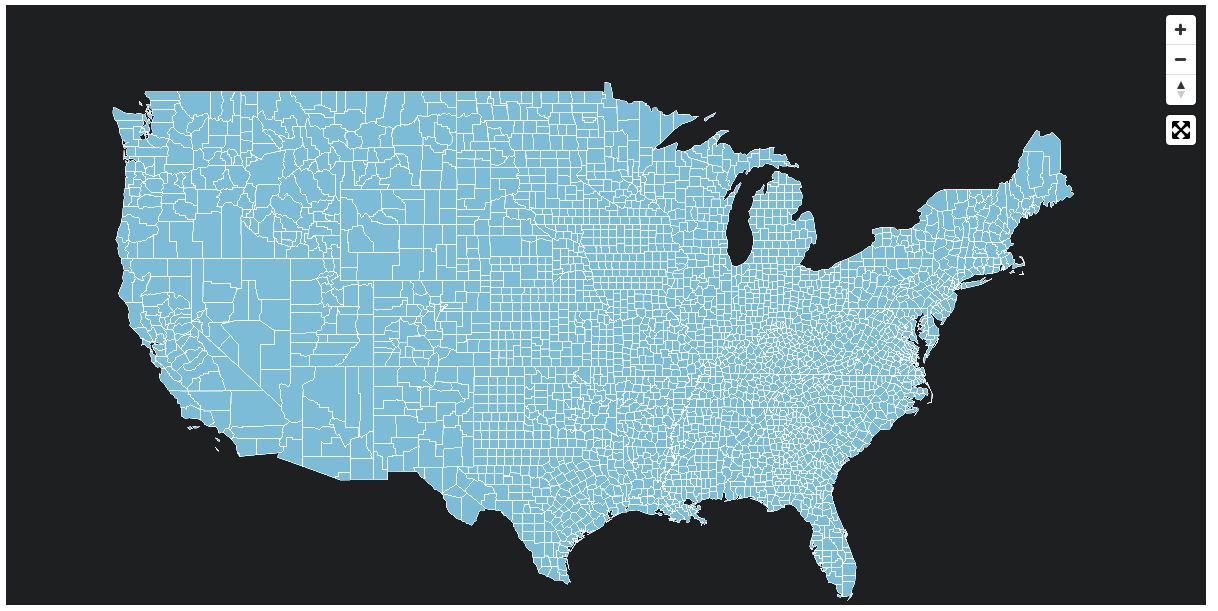
Fill with Data-Driven Styles
Filtering
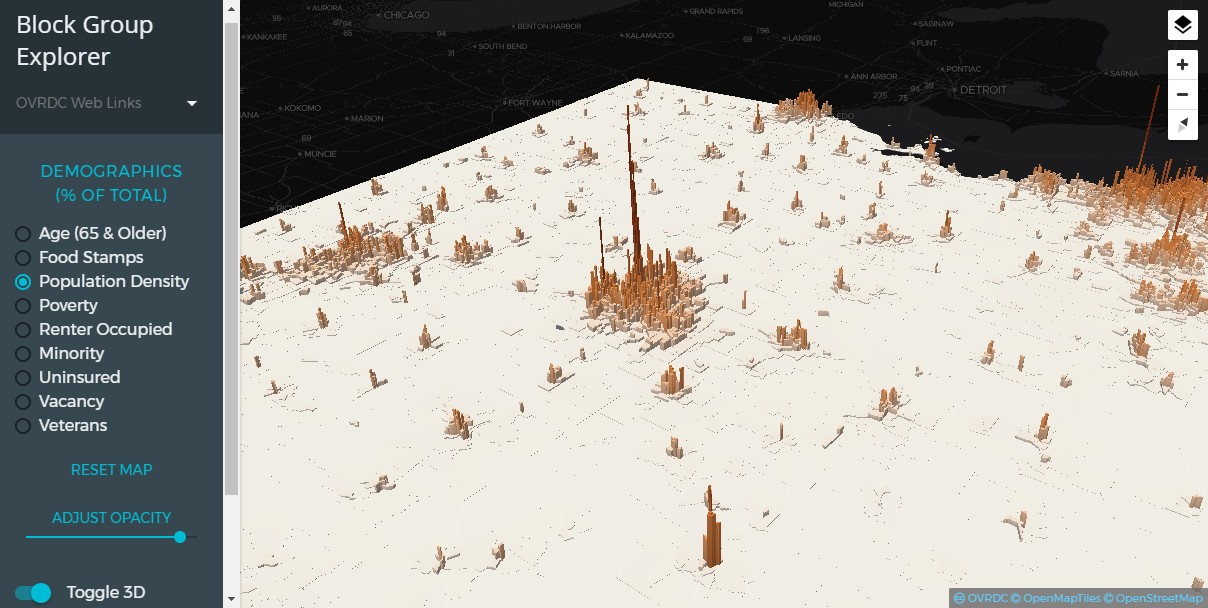
Fill-Extrusion & Pitch
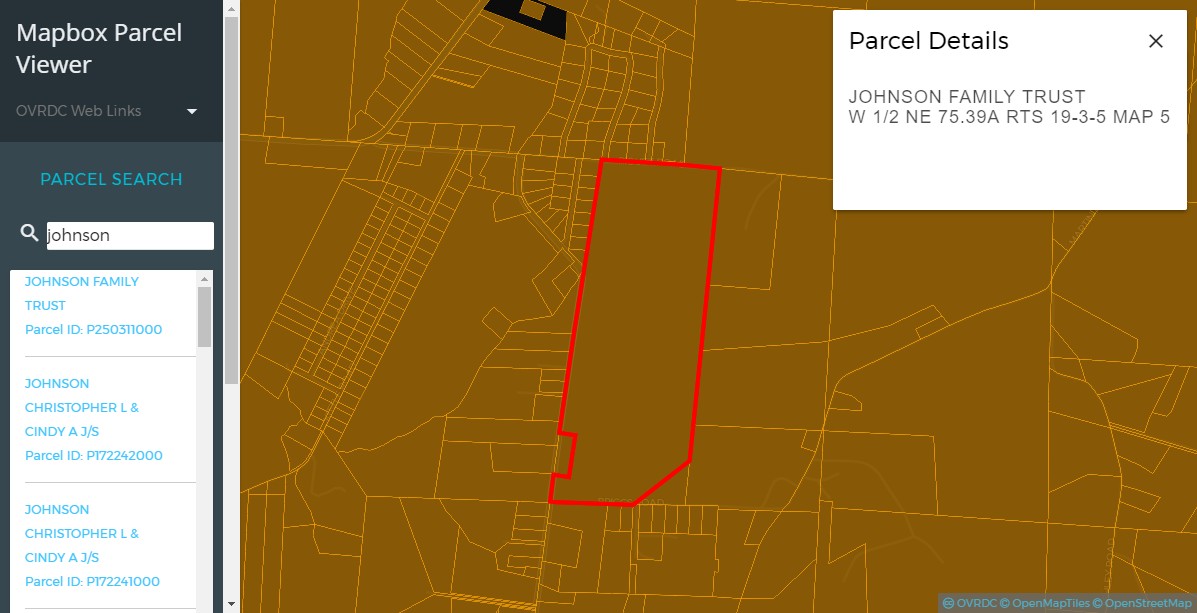
Parcel Viewer & JSON Search
Thanks!
Malcolm Meyer
Slide Sources
https://stackoverflow.com/questions/36426428/mapbox-gl-js-3d-elevation-profile http://scottsfarley.com/cartography/coding/2017/02/11/DC-Mapbox-Plugin.html https://blog.mapbox.com/shading-and-lighting-3d-features-in-mapbox-gl-js-e544695cd64 https://blog.mapbox.com/introducing-data-driven-styling-in-mapbox-gl-js-f273121143c3 https://blog.mapbox.com/dive-into-large-datasets-with-3d-shapes-in-mapbox-gl-c89023ef291